In today’s fast-moving lifestyle, especially across busy New Jersey cities like Jersey City, Newark, Hoboken, and Cherry Hill, keeping a home consistently clean has become more challenging than ever. Between long work hours, commuting stress, hybrid work routines, and family responsibilities, most homeowners find themselves constantly falling behind on basic cleaning tasks. What once used to be a simple weekend routine has now turned into an ongoing struggle that never truly feels finished. This growing pressure is exactly why cleaning statistics in 2026 matter more than ever. They reveal a deeper truth: it’s not that people don’t care about cleanliness; it’s that modern life leaves very little time and energy to maintain it properly. As a result, homes may appear clean on the surface, while hidden dirt, missed zones, and inconsistent routines continue to build up in the background.
| Metric | Key 2026 Statistic | Core Impact / Takeaway |
| Global Market Valuation | $481.75 Billion | Projecting steady expansion to $859.20B by 2034 |
| Market Growth Rate (CAGR) | 7.5% | Defensive, recurring sector unaffected by market volatility |
| Household Outsourcing | 41% of U.S. Households | High demand in fast-paced metro and commuter areas |
| Mental Health Boost | 87% of Homeowners | Tidy environments directly elevate mental & physical wellness |
| Stress & Anxiety Reduction | 60% Drop in Stress | Immediate mood and productivity recovery post-cleaning |
| Monthly Cleaning Frequency | Kitchens: 20x | Bathrooms: 16–20x | High-traffic and moisture zones receive priority attention |
| Generational Habit Gap | Gen Z/Millennials: 16–17x/mo | Younger groups clean common areas more often than Boomers (12–14x) |
| Microbial Hotspot: Devices | Keyboards: 3.5M bacteria/sq. in | Portable electronics harbor 10x more bacteria than toilet seats |
| Top Cleaning Tools Used | Disinfectants: 81.7% | Brooms: 80% | Robot vacuums growing rapidly with 30.4% weekly adoption |
| Digital Booking Preference | 62% Online / App Bookings | Consumers expect instant quotes and friction-free scheduling |
Global Cleaning Services Market Size & Forecast (2026 Outlook)
According to multiple industry research reports, the global cleaning services market is valued in the hundreds of billions of dollars and continues to grow at a stable pace.
- The global cleaning services market was valued at approximately USD 451.63 billion in 2025
- It is projected to reach around USD 481.75 billion in 2026
- Long-term forecasts estimate growth to nearly USD 859.20 billion by 2034
- Expected CAGR (2026–2034): around 7.5%
These estimates vary slightly depending on how each research firm defines cleaning services, but the overall direction remains consistent: steady global expansion with no signs of decline. Unlike highly cyclical industries, cleaning services are considered a defensive and recurring-demand sector, meaning growth is supported by everyday operational needs rather than market speculation.
| Industry Sector | Occupation | Minimum Wage Violation Rate | Typical Hourly Wage | Growth Driver | Cleaning Service Type | Service Pricing Range (Inferred) |
| Private households | Maids and housekeeping cleaners | 13.3% | £1.27 below minimum (inferred from $1.62) | Urbanisation and ageing populations | Regular maintenance | £20 – £35 per hour (NJ 2026 benchmark) |
| Accommodation | Maids and housekeeping cleaners | 6.0% | £1.27 below minimum (inferred from $1.62) | Tourism and hospitality standards | Deep cleaning | £45 – £120 per room (NJ 2026 benchmark) |
| Administrative and Support and Waste Management | Janitors, building cleaners, and maids | 4.2% | £1.27 below minimum (inferred from $1.62) | Commercial hygiene compliance and workplace sanitation trends | Regular maintenance and Move-out/Specialist cleaning | £25 – £400 per hour/contract (NJ 2026 benchmark) |
| Residential / Household | Maids and Housekeepers | High (industry-specific trend) | £12.00 – £16.00 (Converted) | Increased disposable income, dual-income households, and change in consumer lifestyle | Maintenance Cleaning (Vacuuming, Floor Care, Dusting) | £35 – £60 per hour |
| Commercial / Real Estate | Commercial Cleaner | Moderate to High | £11.50 – £14.50 (Converted) | Rising facility management and expansion of the real estate sector | Deep Cleaning / Specialist Care (Carpet and Window Cleaning) | £50 – £90 per hour |
| Commercial Cleaning | Janitorial Staff | High (industry-wide challenge) | £12 – £18 per hour | Expansion of commercial infrastructure and outsourcing | Routine facility maintenance | £300 – £2,000+ per month (contract) |
| California Janitorial Market | Janitors / Cleaners | High (due to concerns about wage fraud and worker misclassification) | Not in source | High concentration of commercial establishments and strict environmental/labour regulations | Green Cleaning / Maintenance | $18.00 – $25.00 per hour |
| Texas Janitorial Market | Janitors / Cleaners | High (significant oversight due to wage fraud concerns) | Not in source | Urbanisation and population increase in metropolitan regions | Standard Cleaning / Maintenance | $15.00 – $22.00 per hour |
| Residential Cleaning | Maids and Housekeepers | Not in source | £13.41 – £25.00 | Urbanisation, high median household income, and dual-income households | Maintenance cleaning | £40 – £307 per visit |
| Residential Cleaning | Maids and Housekeepers | Not in source | £13.50 – £19.00 base | Urbanisation, hygiene standards, heavy soil, and real estate turnover | Standard, Deep, or Move-out cleaning | £0.06 – £0.28 per sq ft |
| Residential Cleaning | Maids and Housekeepers | Not in source | £14.00 – £20.00 | High population density and older housing stock requiring intensive maintenance | Recurring Maintenance or Deep Cleaning | £100 – £600 |
| Residential Cleaning | Professional Cleaning Company Staff and Domestic Workers | Not in source | £11.97 – £46.28 | Hygiene standards, demand for insured services, and livable wage legislation | Move-out or Specialist cleaning | £108 – £532 |
| Residential Cleaning | Independent House Cleaners | Not in source | £17.00 – £23.91 | Cost of living adjustments (15-20% above national average) | Deep Cleaning | £170 – £443 |
| Residential Cleaning | Deep Cleaning Specialists | Not in source | £20 – £35 per hour | Heightened hygiene standards and health awareness | Deep cleaning | £200 – £500 per service |
| Short-Term Rental / Hospitality | Cleaning Professionals / Airbnb Cleaners | Not in source | £14.18 – £30.00 | Expansion of short-term vacation rental platforms (Airbnb/VRBO) | Vacation Rental Turnover | £60 – £228 |
| Commercial / Corporate | Commercial Cleaners | Not in source | £15.00 – £21.00 | Need for professional standards and hygiene in business environments | Commercial & Office Cleaning | £150 – £500+ (Contract dependent) |
| Commercial Cleaning | Commercial Cleaner | Not in source | £28.00 – £44.00 per cleaner | Commercial office and retail maintenance | Maintenance | £0.06 – £0.16 per sq ft |
| Construction | Post-Construction Cleaners | Not in source | £13.00 – £25.00 (Converted) | Growing construction industry, urbanisation, and home renovations | Move-out / Post-Construction Cleaning | £150 – £1,200 |
| Residential/Commercial Construction | Construction Cleaner | Not in source | £19.00 – £25.50 | Drywall dust, debris and post-renovation cleanup | Post-construction | £0.24 – £0.48 per sq ft |
| Real Estate / Rental Market | End of Tenancy Cleaners | Not in source | £16.00 – £22.00 | Highly active rental and real estate turnover | Move-In / Move-Out Cleaning | £300 – £750 |
| Education / Public Sector | School Caretakers / Cleaners | Not in source | £14.50 – £19.00 | Specific hygiene requirements for high-traffic educational spaces | School & Daycare Cleaning | £200 – £800+ |
| Specialised Cleaning | Restoration Specialists | Not in source | £20.00 – £30.00 | Management of long-vacant units and inherited properties | Hoarder & Intensive Cleaning | £1,000 – £5,000+ |
| Healthcare / Hospitality | Sanitation Technicians | Not in source | £15 – £22 per hour | Strict hygiene and risk management regulations | Disinfection services | £150 – £400 per visit |
| Traveler Accommodation | Maids and Housekeeping Cleaners | Not in source | $16.28 | Urbanisation and hygiene standards | Maintenance | $40 – $65 per hour |
| General Medical and Surgical Hospitals | Maids and Housekeeping Cleaners | Not in source | $19.18 | Clinical hygiene standards | Deep cleaning | $50 – $80 per hour |
| Services to Buildings and Dwellings | Maids and Housekeeping Cleaners | Not in source | $16.59 | Urbanisation and facility management demand | Move-out services | $150 – $450 per service |
| Nursing Care Facilities | Maids and Housekeeping Cleaners | Not in source | $14.78 | Ageing population and health regulations | Maintenance | $35 – $55 per hour |
| Drycleaning and Laundry Services | Maids and Housekeeping Cleaners | Not in source | $23.92 | Specialised garment care demand | Deep cleaning | $60 – $90 per hour |
| Cleaning Services (General/Small Employer) | Maids and Housekeepers | Not in source | £11.45 ($15.23) | Urbanisation and hygiene standards | Maintenance | £25 – £40 per hour |
| Cleaning Services (Large Employer) | Janitors and Cleaners | Not in source | £11.97 ($15.92) | Consumer Price Index (CPI) adjustments | Deep Cleaning | £45 – £75 per hour |
| Residential Janitorial Services | Housekeepers / Professionals | Not in source | Not in source | Growing consumer awareness of professional cleaning benefits | Standard Cleaning | $150.00 – $350.00 per visit |
| Commercial / Corporate Offices | Janitors | Not in source | Not in source | Expansion of commercial infrastructure and outsourcing for efficiency | Maintenance / Standard Cleaning | $0.10 – $0.30 per square foot |
| Healthcare / Medical Institutions | Cleaning Specialists | Not in source | Not in source | Increased significance of preventive healthy practices | Disinfection / Deep Cleaning | $45.00 – $90.00 per hour |
| Retail / Premium Merchants | Floor Care Technicians | Not in source | Not in source | Need for sanitation by retail corporations to protect customer health | Carpet Washing / Floor Care Services | $0.25 – $0.55 per square foot |
| Janitorial Services (General) | Cleaners / Janitors | Not in source | Not in source | Damage restoration needs and institutional infrastructure growth | Damage Restoration / Move-out Services | $300.00 – $800.00 |
House Cleaning Frequency and Time Spent
How Often Do Americans Clean Their Homes?
While everyone’s personal threshold for mess varies, national survey data shows that high-traffic household zones get the most consistent attention. Kitchens lead the pack as the most frequently managed area, averaging 20 cleanings per month due to daily meal preparation, food spills, and basic hygiene needs. Bathrooms follow closely behind, seeing deep sanitation routines between 16 to 20 times a month to keep soap scum and moisture buildup at bay. Meanwhile, common living spaces, such as bedrooms, living rooms, and dining areas, are typically cleaned 14 to 17 times a month, depending heavily on the number of occupants in the household.
Generational Differences in Cleaning Frequency
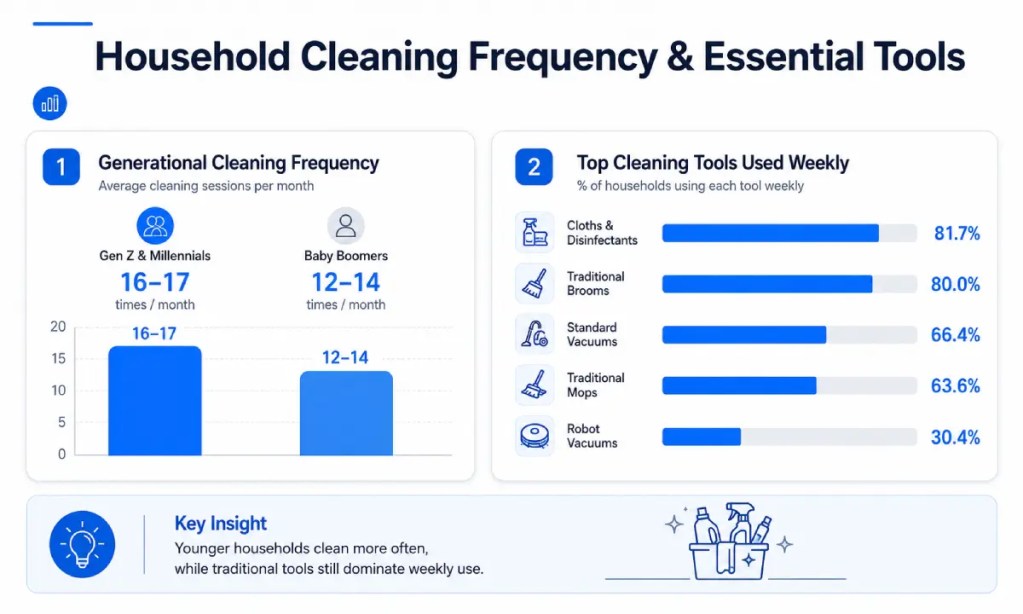
- Gen Z and Millennials tend to clean their homes more frequently than older generations. They clean common areas like bedrooms, living rooms, and dining rooms an average of 16-17 times per month, whereas Baby Boomers clean these areas only 12-14 times per month.
House Cleaning Statistics 2026 Market & Trends Data - Younger Americans also spend more time cleaning floors and kitchen surfaces due to increased awareness of hygiene and cleanliness.
This generational gap reflects a shift in cleaning behaviors, with younger Americans more likely to maintain cleanliness as part of a routine. At the same time, older generations might rely more on professional cleaning services or clean less often.
The Real Time Investment: Cleaning by the Numbers
When you add up the minutes spent keeping a household running, housework demands a massive chunk of our limited weekly free time. On average, Americans spend roughly 56 minutes per week strictly on floor maintenance, which includes vacuuming, sweeping, and mopping. However, this time investment changes dramatically when looking at household income and demographics. Wealthier households earning over $200,000 spend an average of 28 minutes more per week caring for their floors compared to households earning under $25,000, often because larger homes feature more square footage to maintain. From a gender perspective, men spend about 58.9 minutes per week on floor care, compared to women’s 54.2 minutes, though sociological studies consistently show that women still shoulder a significantly higher overall volume of daily domestic chores and multitasking.
Clean Spaces, Clean Minds: The Mental Health Connection
One of the most profound realizations in modern domestic research is that keeping an orderly home is not just about keeping up appearances; it is a vital pillar of psychological wellness. Data from the American Cleaning Institute proves that an overwhelming 87% of Americans experience a direct boost to their mental and physical well-being when their living spaces are tidy. Clutter throws off our focus and spikes stress hormones, whereas a freshly sanitized home acts as a mental reset. If you are struggling to keep up with the mess, you aren’t just losing time; you are sacrificing your mental peace.

How Tidiness Directly Boosts Your Daily Mood
A deeper dive into the psychology of a clean home shows that the emotional benefits extend far beyond a simple sense of accomplishment. According to industry surveys, 66% of respondents report that a clean environment instantly improves their overall daily mood, while 63% experience a noticeable spike in their personal productivity when their surroundings are organized. Most importantly, 60% of individuals experience a significant decrease in daily stress and anxiety levels immediately after a chore is finished. This powerful psychological relief explains why 80% of U.S. households still prioritize rigorous seasonal cleaning rituals to clear out the mental and physical clutter that accumulates throughout the year.
Cleaning Blindspots: What Gets Skipped Most Often?

Microbial Realities in Everyday Spaces
While visible clutter often drives the urge to tidy up, the microscopic reality of an uncleaned home presents a compelling argument for maintaining strict sanitization schedules. Microbiological research reveals that some of the most frequently touched surfaces in residential spaces harbor surprisingly high bacterial loads. For instance, a standard kitchen sink typically contains over 100,000 more bacteria than a bathroom sink, turning it into a primary hotspot for foodborne pathogens if left untreated. Even worse, for New Jersey residents operating hybrid workspaces or catching up on emails from home, a typical computer keyboard accumulates roughly 3.5 million bacteria per square inch. Everyday portable electronics are equally problematic; the average smartphone harbors 10 times more bacteria than a standard toilet seat, while a living room remote control carries 70% more bacteria than a toilet handle, emphasizing the critical need for routine disinfection beyond surface-level dusting.
Commonly Neglected Areas
- Window Blinds: 29% of Americans report skipping the cleaning of window blinds. This task is often missed because it requires a ladder or extended reach, and blinds don’t show dirt or dust as easily as floors or countertops.
- Baseboards: 27% of Americans neglect to clean their baseboards regularly. Baseboards collect dust, pet hair, and dirt, but many people avoid cleaning them because they are low to the ground and hard to reach.
- Ceiling Fans & Windowsills: 23% of people skip cleaning ceiling fans and windowsills. Ceiling fans accumulate dust and can spread it throughout the room when turned on, yet they’re often overlooked in regular cleaning routines.
Why Do People Skip These Tasks?
Many of these areas require more time and effort to clean compared to visible spaces like countertops or floors. However, neglecting them can result in dirty air, allergic reactions, or a generally unkempt appearance, even if the more obvious areas look clean.
Overcoming Domestic Barriers: Motivation, Time, and Pets
Maintaining a pristine living environment is a continuous struggle against a variety of daily obstacles, with mental fatigue and time constraints dictating how much chores get done. Data indicates that 33.3% of individuals actively struggle with the pure motivation and energy required to clean after handling demanding professional obligations. Furthermore, 15.6% of people state that severe time scarcity prevents them from completing basic house upkeep. These challenges multiply exponentially for pet owners; roughly 23.9% of households face the daily battle of managing pet dander, tracked-in mud, shedding hair, and food spills. The physical exhaustion of constantly cleaning up after animals often causes busy homeowners to experience burnout, leaving deeper sanitization tasks completely abandoned.
Tools and Technology Used for Cleaning
Technology is increasingly becoming a game-changer in the cleaning industry. From robot vacuums to smart cleaning products, Americans are using a variety of tools to streamline their cleaning tasks.
Tools Americans Use Most
- Cloths & Disinfectants: 81.7% of Americans use cleaning cloths and disinfectants weekly. These are staples in most households for wiping down surfaces and maintaining hygiene.
- Brooms: 80% of people use a broom to sweep their floors weekly, making it one of the most common tools for basic floor cleaning.
- Vacuum Cleaners: 66.4% of Americans use non-robotic vacuums to clean their floors weekly, while 63.6% use traditional mops.
- Robot Vacuums: Interestingly, 30.4% of Americans now use robot vacuums for cleaning, reflecting the growing popularity of automated cleaning devices. These devices are especially popular in households with busy schedules, allowing for hands-free floor cleaning.
The Changing Economics of the Professional Cleaning Sector
The professional cleaning sector has experienced an intense financial evolution as macroeconomic shifts directly influence how domestic businesses operate. Globally, the cleaning services industry has surged to a valuation of $482 billion, maintaining a steady compound annual growth rate of 7.5% as both residential and commercial properties elevate their hygiene benchmarks. For business owners, adapting to this market requires balancing a sharp increase in operational costs with competitive pricing. Statistically, 55% of cleaning business owners across the country have safely raised their service rates over the past year to offset inflation and rising labor costs. Today, a professional house cleaner earns an average national salary of $35,034, while successful cleaning business owners see average yearly earnings of $127,973, highlighting a lucrative but increasingly demanding service market.
The Rise of Outsourcing: Reclaiming Time in the Garden State
As the boundaries between work and home life continue to blur, an increasing number of homeowners are actively choosing to buy back their weekend hours by outsourcing household labor. National data confirms that 41% of U.S. households now regularly hire professional cleaning services to manage their properties, with a significant concentration of this demand originating from fast-paced, high-income regions. This shift is deeply evident across New Jersey, where busy professionals commuting into New York City or Philadelphia find themselves facing severe time scarcity. Instead of spending their limited days off scrubbing tiles or dusting baseboards, families are treating professional home care not as an indulgent luxury, but as an essential investment in their personal time, mental health, and overall quality of life.
The Digital Integration of Modern Home Services
The modern consumer expects seamless, friction-free transactions, and the cleaning industry has rapidly digitized to meet these fast-paced expectations. Research indicates that 62% of all residential cleaning appointments are now booked entirely online or through specialized mobile applications. Homeowners no longer want to play phone tag for quotes or deal with manual invoicing; they prefer instant pricing transparency, automated scheduling, and secure digital payment gateways. Cleaning brands that have failed to adopt mobile-friendly, instant-booking interfaces are quickly losing market share to tech-enabled operations that allow a homeowner to schedule a comprehensive deep clean in under two minutes while sitting on a commuter train.
How New Jersey Homeowners Can Protect Their Spaces
For residents living in high-density, fast-paced New Jersey communities like Hoboken, Princeton, or Toms River, choosing the right local partner is the ultimate key to maintaining a stress-free household. Balancing grueling professional commitments while attempting to eliminate the millions of microbes lurking on everyday household surfaces is a losing battle without expert assistance. If you are ready to stop fighting the daily war against dust bunnies, pet dander, and neglected baseboards, letting a premium, highly rated service take over is the most logical step forward. By trusting your home to the trained professionals at RMS Cleaning, you instantly eliminate domestic burnout, safeguard your family’s health, and step back into the beautifully sanitized, high-vibe living space you deserve.
References:
https: //www.bls.gov/charts/american-time-use/activity-by-hldh.htm
https: //summitjanitorial.com/2024/12/20/cleaning-facts
https: //www.rush.edu/news/health-benefits-cleaning